
The Post-Concussion Symptom Scale: Looking Beyond the Total Score
by Associate Professor James McLoughlin, Chief Academic Officer, Your Brain Health
Following concussion, we need to track symptoms. It is up to the clinician to decide when and how often to do this, as over-testing may not always be helpful and can potentially reinforce illness behaviour. However, there are important points during recovery when we want to understand how a patient perceives their symptoms and gain a clearer picture of recovery from their perspective.
The Post-Concussion Symptom Scale (PCSS) is one of the most commonly used scales for tracking symptoms following concussion. It is used acutely and throughout the recovery journey. It is also increasingly used as part of baseline testing because, as clinicians know, people are not necessarily symptom-free before a concussion. Understanding baseline symptoms can therefore provide some interesting and useful insights.
The PCSS is most closely associated with the work of Mark Lovell and colleagues in sports concussion. It evolved into the familiar 22-item symptom inventory, with each symptom rated from 0 (none) to 6 (severe), producing a total symptom severity score ranging from 0–132. Symptoms span physical, cognitive, sleep-related and emotional domains.
During the 2000s, the PCSS became widely used in sports concussion research and clinical practice. Importantly, it was increasingly recognised that the individual symptoms are not specific to concussion. Headache, fatigue, poor concentration, sleep disturbance and mood symptoms can also occur in healthy people and across many other clinical populations.
The PCSS has subsequently been studied for reliability, validity, factor structure and responsiveness to recovery. Research has also examined symptom clusters and domains rather than simply relying on the total score.
The 22 symptoms of the PCSS have become highly influential in international concussion assessment. The symptom evaluation used in the SCAT family of tools uses essentially the same 22 symptoms and 0–6 severity framework, which is one reason this symptom set is now so familiar in concussion practice.
Importantly, the PCSS is fundamentally a patient-reported measure of symptom severity, not a diagnostic test. Its greatest value is in quantifying symptom burden at a particular point in time and tracking change longitudinally. It should therefore sit alongside, rather than replace, objective measures of cognition, balance, vestibular and oculomotor function, exercise tolerance and other relevant clinical domains.
Using the PCSS in ScreenIT
ScreenIT allows for fast collection and interpretation of PCSS data. The scale forms part of the SCAT6 within ScreenIT, but it can also be administered independently at any point during the recovery journey.
ScreenIT recognises when the PCSS has been completed, whether in isolation or as part of another assessment or bundle, allowing symptom scores to be tracked longitudinally across recovery.
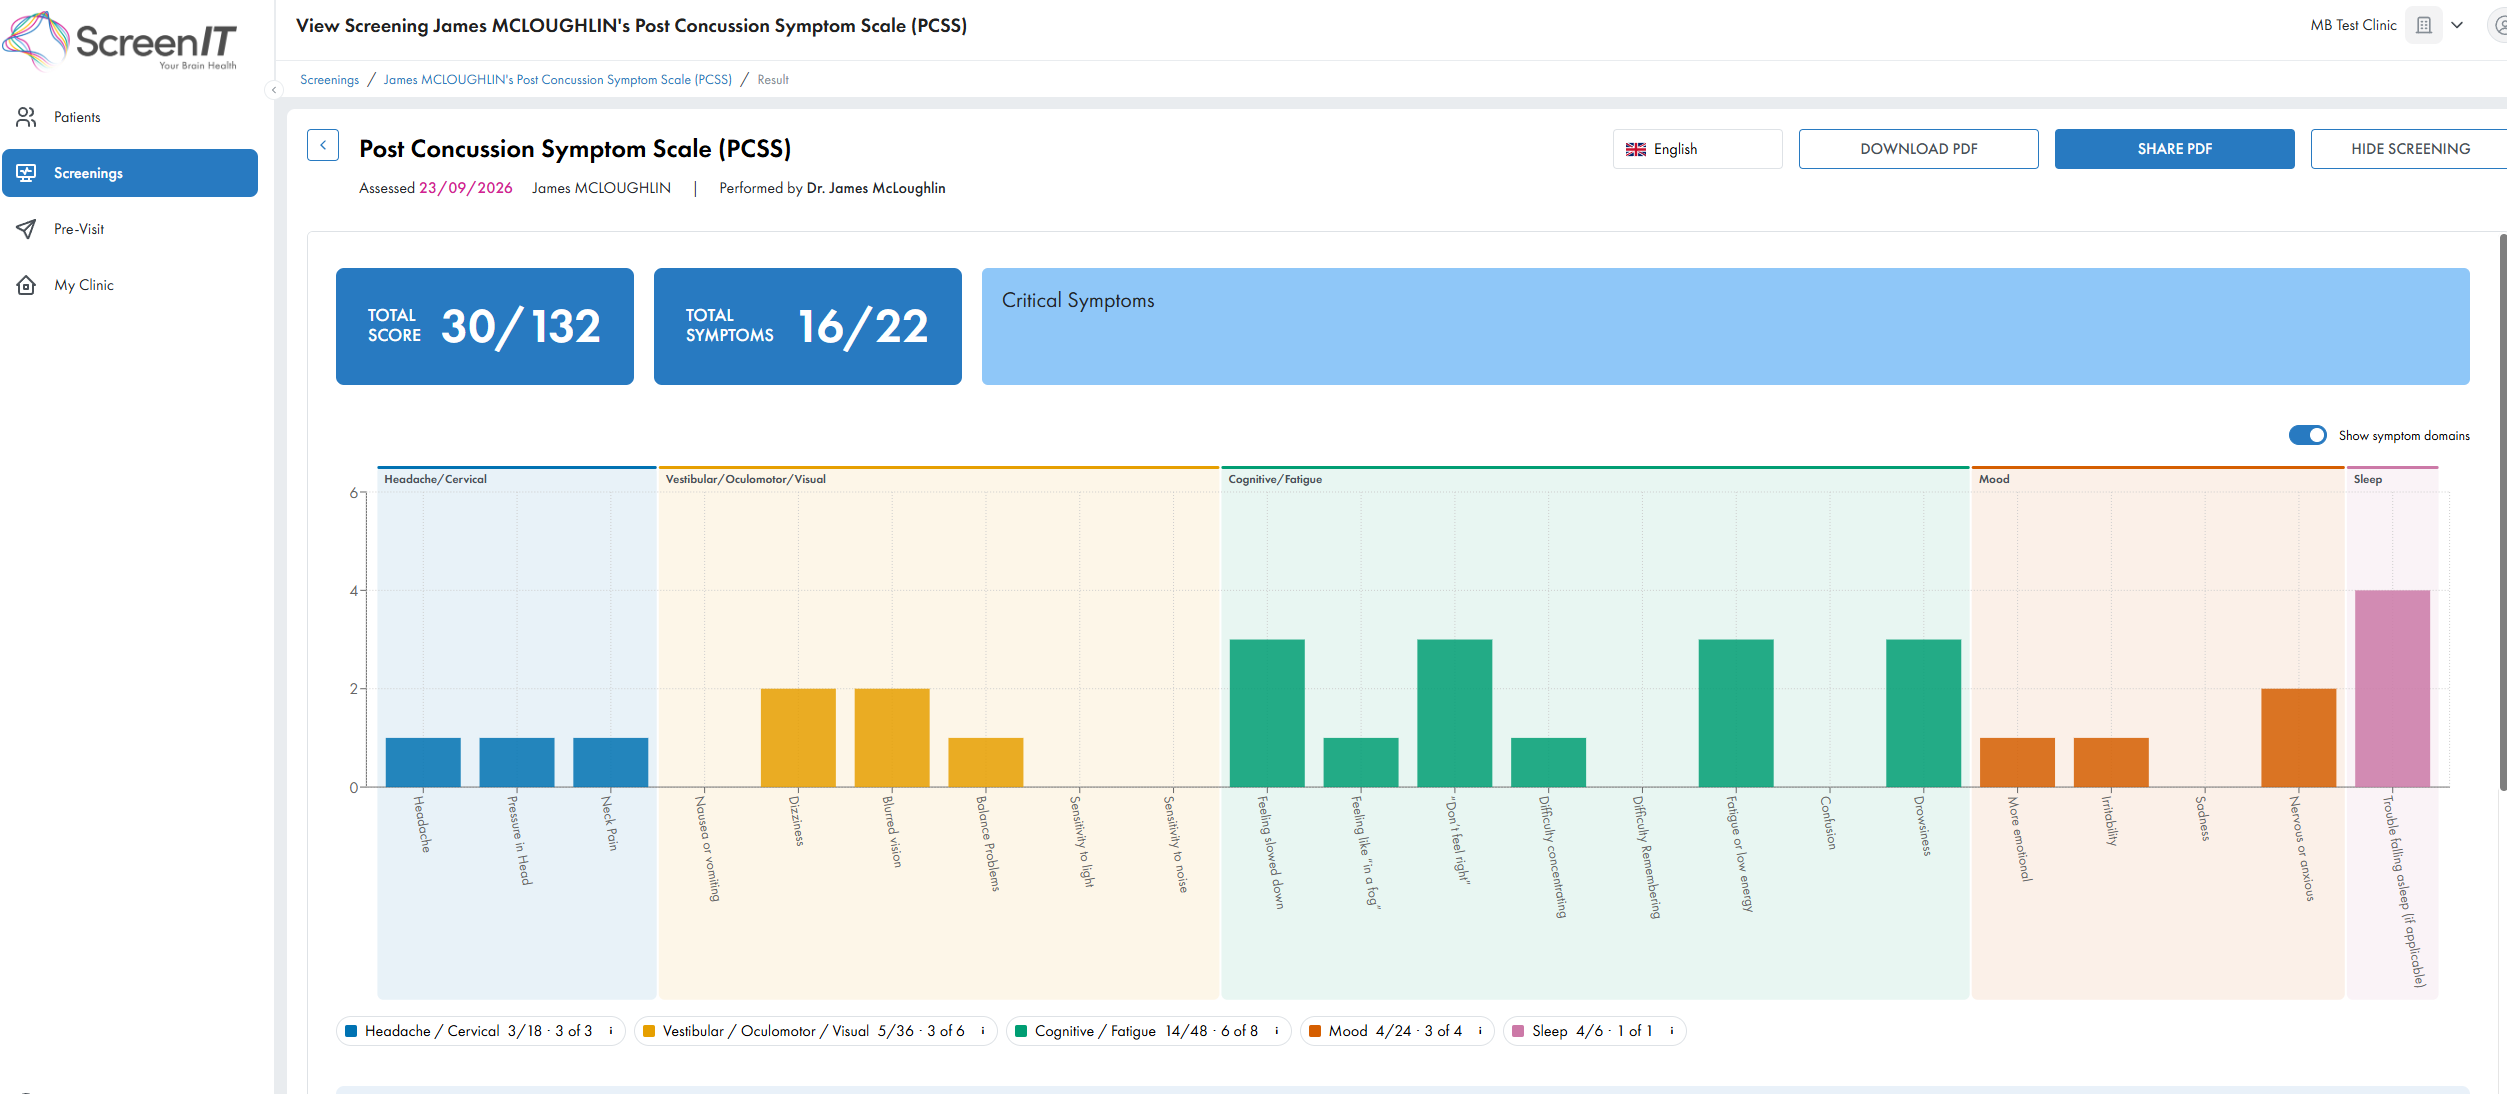
The ScreenIT PCSS report displays the total symptom severity score out of 132, the number of symptoms reported out of 22, and highlights symptoms rated 4 or greater out of 6. Each individual symptom is also displayed graphically, making the overall symptom profile easy to interpret.
Key questions are highlighted, including perhaps one of the most useful questions within the assessment:
“If 100% is feeling perfectly normal, what percent of normal do you feel? If not 100%, why?”
It is an incredibly simple but powerful question. It gives the patient an opportunity to step back from individual symptom ratings and provide their own overall perspective on where they are in their recovery.
Looking beyond the total score
One of my favourite ScreenIT functions is the ability to visualise symptom domains.
On the PCSS bar graph (Figure 1), selecting “Show symptom domains” groups the symptoms into colour-coded sections covering:
- headache/cervical
- vestibular/oculomotor/visual
- cognitive/fatigue
- mood
- sleep
This allows us to quickly identify patterns within the symptom profile. Clinically, these patterns can prompt further questions and examination, guide additional investigation where appropriate, and help focus treatment towards the domains that appear most relevant.
Figure 1: The Show symptom domains toggle on the right side above graphs.
It is common during recovery for the broader symptom burden to settle while one or two domains remain prominent. These residual domains can then become a particular focus of assessment and intervention, both during acute recovery and in people experiencing persisting symptoms.
This is a good example of how digital health tools can take a relatively simple clinical measure and make the information easier to collect, visualise and interpret—ultimately making clinical practice more efficient while providing a clearer picture of the patient’s recovery.
References
Kontos, A. P., Elbin, R. J., Schatz, P., Covassin, T., Henry, L. C., Pardini, J., & Collins, M. W. (2012). A revised factor structure for the Post-Concussion Symptom Scale: Baseline and postconcussion factors. The American Journal of Sports Medicine, 40(10), 2375–2384. https://doi.org/10.1177/0363546512455400
Lovell, M. R., & Collins, M. W. (1998). Neuropsychological assessment of the college football player. Journal of Head Trauma Rehabilitation, 13(2), 9–26. https://doi.org/10.1097/00001199-199804000-00004
Lovell, M. R., Iverson, G. L., Collins, M. W., Podell, K., Johnston, K. M., Pardini, D., Pardini, J., Norwig, J., & Maroon, J. C. (2006). Measurement of symptoms following sports-related concussion: Reliability and normative data for the Post-Concussion Scale. Applied Neuropsychology, 13(3), 166–174. https://doi.org/10.1207/s15324826an1303_4